GCE(O/L) Past Paper Questions
- The given flowchart models the generation of some numbers in a certain range. Write the first three and the last three numbers that it generates.
- Write a Pseudo-code that corresponds to the logic indicated by the flowchart.
- State how to modify the given flowchart to display the number sequence
1,4,9,16,25,36,49.
Answer
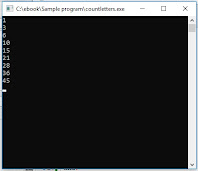
Output of the above Pascal Program
 i)

First three numbers  1,3,6
Last three numbers 28,36,45

(The variable T gets the values within the repetition are
1,3,6,10,15,21,28,36,45
and next number would be 55 but it is greater than 50,
So  repetition will stop and program will end)


ii)
start
X=1
T=1
//repetition start
repeat
    display T  //output statement
    X=X+1
    T=T+X
until T>50 //repetition end
end


iii)
Change X=X+1 into X=X+2

Note
Convert the above Flowchart or Pseudocode into any programming language and run it for extra knowledge.

Pascal program  is given below

program numseries;
var
  X:integer;
  T:integer;
begin
  X:=1;
  T:=1;
  repeat
    writeln(T);
    X:=X+1;
    T:=T+X
  until T>50;
  readln;
end.
Output of the above Pascal Program
Question 2
Click here to get more Flowchart questions
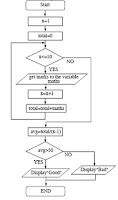
a)Write the appropriate Pseudo code for the above flowchart
b) Write Pascal /Python Coding
 a)
Pseudocode

start
x=1
total=0
while x<=10
 get marks to the variable maths
 x=x+1
 total=total+maths
endwhile
avg=total/(x-1)
if avg>50
 display "Good"
else
 display "Bad"
endif
end


b)
Python Program for the above Flowchart
x=1
total=0
while x<=2:
 maths=eval(input('Enter Mathematics marks?'));
 x=x+1
 total=total+maths
avg=total/(x-1)
if avg>50:
 print('Good')
else:
 print('Bad')


Pascal Program for the above flowchart
prgram print_average;
var
  x, maths:integer;
  total,avg:real;
begin
  x:=1;
total:=0;
while (x<=10) do
begin
 write('Enter Mathematics Marks?');
 readln(maths);
 x:=x+1;
 total:=total+maths;
end;
avg:=total/(x-1);
if (avg>50) then
 writeln('Good')
else
 writeln('Bad');
        readln;
end.
Click here to get more Flowchart questions


superb
ReplyDeleteInteresting
ReplyDeleteThis is a very interesting breakdown of how the flowchart models number generation using repetition and conditions! The step-by-step logic makes it easy to understand how variables like X and T evolve through each iteration. If anyone is looking for a way to experiment with similar examples or design their own flowcharts, < flowchart makercould be a handy tool. It helps visualize logic like this in a clean and interactive way!
ReplyDelete